
Page 20 - Rapport annuel 2022 ANG
P. 20
Port Activity
in 2022
The year 2022 was characterized by the continued effects of the global health crisis and an unprecedented inflationary context.
This inflation was due to a double shock experienced by the world economy, namely, (i) a supply shock caused by a shortage of
industrial goods due to repeated shutdowns mandated by China’s zero-Covid policy, and (ii) a demand shock brought about by
changes in consumption habits, especially with the acceleration of e-commerce development. These shocks were compounded
by stimulus policies adopted by various countries.
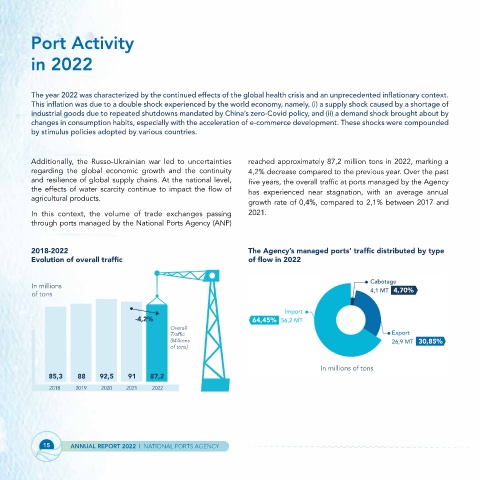
Additionally, the Russo-Ukrainian war led to uncertainties reached approximately 87,2 million tons in 2022, marking a
regarding the global economic growth and the continuity 4,2% decrease compared to the previous year. Over the past
and resilience of global supply chains. At the national level, five years, the overall traffic at ports managed by the Agency
the effects of water scarcity continue to impact the flow of has experienced near stagnation, with an average annual
agricultural products.
growth rate of 0,4%, compared to 2,1% between 2017 and
In this context, the volume of trade exchanges passing 2021.
through ports managed by the National Ports Agency (ANP)
2018-2022 The Agency’s managed ports’ traffic distributed by type
Evolution of overall traffic of flow in 2022
Cabotage
In millions
of tons 4,1 MT 4,70%
Import
-4,2% 64,45% 56,2 MT
Overall
Traffic Export
(Millions 26,9 MT 30,85%
of tons)
In millions of tons
85,3 88 92,5 91 87,2
2018 2019 2020 2021 2022
15 ANNUAL REPORT 2022 I NATIONAL PORTS AGENCY